Using Chryso®V-Mar® 3 (Rheology Modifying Admixture) to Reduce Concrete Pump Pressure – TB-1402

The successful pumping of concrete is dependent on a number of factors including having a suitable concrete mix. Fine, naturally rounded sand is ideal for producing pumpable concrete, but as the supply of fine, naturally rounded sand decreases, concrete producers are forced to utilize materials such as manufactured sands that are often coarse, angular, and gap-graded. Use of these materials can lead to segregation while pumping, and increased pump pressure. The fundamental reason coarse angular sands do not perform as well as naturally-rounded sand is due to their inability to “flow” within the concrete matrix.
Chryso®V-Mar® 3 has a unique polymeric structure that, under the influence of energy (e.g. vibration or pumping), aligns itself and allows coarse angular sand to flow similarly to naturally-rounded sand. At this point the polymers slide over each other in the direction of flow and reduce the yield stress of the concrete, essentially lubricating the pump hose, reducing internal friction, and reducing the pressure necessary to pump the concrete. As energy is removed, the polymers interlock leaving the concrete as it was before movement. Chryso®V-Mar® 3 has been shown to have a neutral effect on most concrete properties, as evidenced by the setting time, air entrainment, and compressive strength data in Table 1 below.
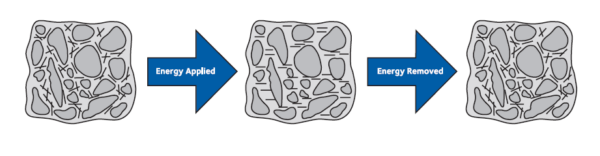
Table 1 – Neutral Effect of Chryso®V-Mar 3 on Concrete Properties (SI Units)
| Cement, kg/m3 | 335 | 335 | 335 | 335 | 335 |
| Stone, kg/m3 | 798 | 798 | 798 | 798 | 798 |
| Total Sand, kg/m3 | 1026 | 1026 | 1026 | 1026 | 1026 |
| Total Mix Water, kg/m3 | 193 | 193 | 193 | 193 | 193 |
| HRWR Admixture, mL/100 kg | 300 | 300 | 300 | 300 | 300 |
| Chryso®V-Mar 3, mL/100 kg | — | 60 | 110 | 170 | 220 |
| Air, % | 1.1 | 1.5 | 1.3 | 1.4 | 1.6 |
| Initial Set, hrs:min | 4:10 | 3:55 | 4:10 | 4:15 | 4:25 |
| Compressive Strength @ 1 Day, MPa | 11.0 | 10.3 | 10.9 | 10.9 | 10.8 |
| Compressive Strength @ 7 Days, MPa | 24.5 | 25.4 | 24.9 | 26.3 | 27.9 |
| Compressive Strength @ 28 Days, MPa | 31.2 | 32.7 | 32.5 | 33.1 | 35.6 |
Table 2 – Neutral Effect of Chryso®V-Mar 3 on Concrete Properties (English Units)
| Cement, lb/yd3 | 564 | 564 | 564 | 564 | 564 |
| Stone, lb/yd3 | 1345 | 1345 | 1345 | 1345 | 1345 |
| Total Sand, lb/yd3 | 1730 | 1730 | 1730 | 1730 | 1730 |
| Total Mix Water, lb/yd3 | 325 | 325 | 325 | 325 | 325 |
| HRWR Admixture, oz/cwt | 4.6 | 4.6 | 4.6 | 4.6 | 4.6 |
| Chryso®V-Mar 3, oz/cwt | — | 0.9 | 1.7 | 2.6 | 3.4 |
| Air, % | 1.1 | 1.5 | 1.3 | 1.4 | 1.6 |
| Initial Set, hrs:min | 4:10 | 3:55 | 4:10 | 4:15 | 4:25 |
| Compressive Strength @ 1 Day, lb/in.2 | 1600 | 1500 | 1580 | 1580 | 1560 |
| Compressive Strength @ 7 Days, lb/in.2 | 3560 | 3680 | 3610 | 3820 | 4040 |
| Compressive Strength @ 28 Days, lb/in.2 | 4530 | 4740 | 4720 | 4800 | 5170 |
The following examples show how the incorporation of manufactured sand in pumped concrete was made possible by utilizing Chryso®V-Mar® 3 as a pumping aid. The addition of Chryso®V-Mar® 3 to the concretes led to pump pressures being maintained at levels equal to or below the pressures produced by the control concrete, which did not contain manufactured sand.
It must be noted that these are examples only. The use of manufactured sand from different sources and/or in different amounts will have different effects on pumping pressure, and the Chryso®V-Mar® 3 requirements will also vary. Tests must be conducted on the various mix designs, replacement amounts of manufactured sand, and dosage rates of Chryso®V-Mar® 3 before the start of a project. An improper mix design, although pumpable, may still be harsh and difficult to place.
Example 1 – Portland Cement Concrete (SI Units)
| Manufactured Sand Content | 0% | 40% | 40% | 60% | 60% |
| Cement, kg/m3 | 274 | 282 | 272 | 275 | 271 |
| Stone, kg/m3 | 964 | 979 | 957 | 946 | 955 |
| Total Sand, kg/m3 | 883 | 905 | 914 | 921 | 907 |
| Total Mix Water, kg/m3 | 196 | 201 | 201 | 206 | 201 |
| WR Admixture, mL/100 kg | 190 | 190 | 190 | 190 | 190 |
| Chryso®V-Mar 3, mL/100 kg | — | — | 185 | — | 185 |
| Slump, mm | 114 | 95 | 127 | 114 | 127 |
| Air, % | 1.1 | 0.8 | 0.8 | 0.8 | 0.8 |
| Pump Pressure, MPa | 6.5 | 7.6 | 6.5 | 10.9 | 4.8 |
Example 1 – Portland Cement Concrete (English Units)
| Manufactured Sand Content | 0% | 40% | 40% | 60% | 60% |
| Cement, lb/yd3 | 462 | 475 | 459 | 464 | 457 |
| Stone, lb/yd3 | 1625 | 1651 | 1613 | 1594 | 1611 |
| Total Sand, lb/yd3 | 1488 | 1526 | 1542 | 1553 | 1530 |
| Total Mix Water, lb/yd3 | 330 | 338 | 340 | 347 | 339 |
| WR Admixture, oz/cwt | 3 | 3 | 3 | 3 | 3 |
| Chryso®V-Mar 3, oz/cwt | — | — | 2.8 | — | 2.8 |
| Slump, in. | 4.50 | 3.75 | 5.00 | 4.50 | 5.00 |
| Air, % | 1.1 | 0.8 | 0.8 | 0.8 | 0.8 |
| Pump Pressure, lb/in.2 | 950 | 1100 | 950 | 1580 | 700 |
Example 2 – Portland Cement/Fly Ash Concrete (SI Units)
| Manufactured Sand Content | 0% | 40% | 40% | 60% | 60% | 80%* | 80%* |
| Cement, kg/m3 | 248 | 248 | 252 | 253 | 243 | 246 | 244 |
| Fly Ash, kg/m3 | 65 | 65 | 66 | 66 | 64 | 66 | 64 |
| Stone, kg/m3 | 967 | 968 | 970 | 939 | 926 | 917 | 922 |
| Total Sand, kg/m3 | 887 | 899 | 880 | 926 | 926 | 931 | 935 |
| Total Mix Water, kg/m3 | 178 | 181 | 180 | 177 | 182 | 180 | 186 |
| WR Admixture, mL/100 kg | 260 | 260 | 260 | 260 | 260 | 260 | 260 |
| Chryso®V-Mar® 3, mL/100 kg | — | — | 165 | — | 165 | — | 165 |
| Slump, mm | 127 | 115 | 140 | 127 | 127 | 115 | 115 |
| Air, % | 1.1 | 0.8 | 0.9 | 1.3 | 0.9 | 0.8 | 0.8 |
| Pump Pressure, MPa | 7.6 | 8.6 | 7.6 | 9.0 | 7.6 | 19.3 | 7.9 |
Example 2 – Portland Cement/Fly Ash Concrete (English Units)
| Manufactured Sand Content | 0% | 40% | 40% | 60% | 60% | 80%* | 80%* |
| Cement, lb/yd3 | 417 | 418 | 425 | 427 | 410 | 415 | 411 |
| Fly Ash, lb/yd3 | 110 | 110 | 111 | 111 | 108 | 111 | 108 |
| Stone, lb/yd3 | 1630 | 1632 | 1636 | 1583 | 1562 | 1547 | 1555 |
| Total Sand, lb/yd3 | 1496 | 1515 | 1483 | 1560 | 1562 | 1570 | 1577 |
| Total Mix Water, lb/yd3 | 300 | 305 | 303 | 298 | 306 | 304 | 313 |
| WR Admixture, oz/cwt | 4 | 4 | 4 | 4 | 4 | 4 | 4 |
| Chryso®V-Mar® 3, oz/cwt | — | — | 2.5 | — | 2.5 | — | 2.5 |
| Slump, in. | 5.0 | 4.5 | 5.5 | 5.0 | 5.0 | 4.5 | 4.5 |
| Air, % | 1.1 | 0.8 | 0.9 | 1.3 | 0.9 | 0.8 | 0.8 |
| Pump Pressure, MPa | 1100 | 1250 | 1100 | 1300 | 1100 | 2800 | 1150 |
* In the extreme case of using 80% manufactured sand in these lean mixes, the untreated concrete segregated during the pumping process, and pump pressures rose to
unsustainable levels. However, even though the use of Chryso®V-Mar® 3 reduced the pump pressure to “normal” levels, and the concrete was placeable, it remained more difficult to place than the control mix.
Conclusion
The use of Chryso®V-Mar® 3 in pumped concretes incorporating different levels of manufactured sand reduced the resultant pumping pressures back to the same level as the control concrete, which did not contain manufactured sand.
Since Chryso®V-Mar® 3 is treating the free water in the mix and not the cement (as most concrete admixtures do), dosage rates were originally quoted based on the free water in the concrete. Although accurate, this nomenclature has proved confusing to those used to the more familiar dosage units for admixtures. Thus, typical Chryso®V-Mar® 3 dosages required for pumping applications are found in the range of 1.95 – 3.90 mL/L (¼ – ½ fl oz/gal) of water in the concrete, or 96 – 160 mL/100 kg (1½ – 2½ fl oz/100 lbs) of cementitious materials.